

Read the analysis in a leadership report
What the analysis blocks in Leadership Reports show and how to read them: What Moves Engagement, What Explains Engagement, What Preceded People Leaving, What Makes an Advocate, Where Opinion Is Split and Focus Areas.
On this page
The analysis blocks answer the questions that come after the scores. Not just which driver scores lowest, but which one moves engagement, whether it matters which team someone is in, and what was weakest where people left.
Each block writes its finding as a sentence above the data. When there is not enough data to answer honestly, it says so instead of showing a figure.
Leadership Reports is for Super Admins and is available on request through your Success Manager. If you do not see Leadership Reports under Analyse in the sidebar, it is not switched on for your account yet.
| Block | The question it answers |
|---|---|
| What Moves Engagement | Which drivers move engagement in this organisation, not just which score lowest. |
| What Explains Engagement | Which way of cutting the organisation actually separates people, and by how much. |
| What Preceded People Leaving | Which drivers were weakest in the groups that went on to lose the most people. |
| What Makes an Advocate | What separates the groups that recommend this place from the groups that do not. |
| Where Opinion Is Split | Groups whose answers are split rather than simply low, which an average hides. |
| Focus Areas | Groups below the average, ranked by how many people improvement would reach rather than by the lowest score. |
What Moves Engagement
Each driver is compared against the rest of the survey across your teams, and placed on a chart by how closely it tracks engagement and how it scores. The block names the strongest candidate in a sentence, then lists each driver with what to do:
| Label | Meaning |
|---|---|
| Protect | Moves engagement here, and is already strong. Losing it would cost you. |
| Fix first | Moves engagement here, and currently scores below your median. |
| Watch | Scores low, but does not track engagement across your groups. |
| Maintain | Scoring well and not a lever. No action needed. |
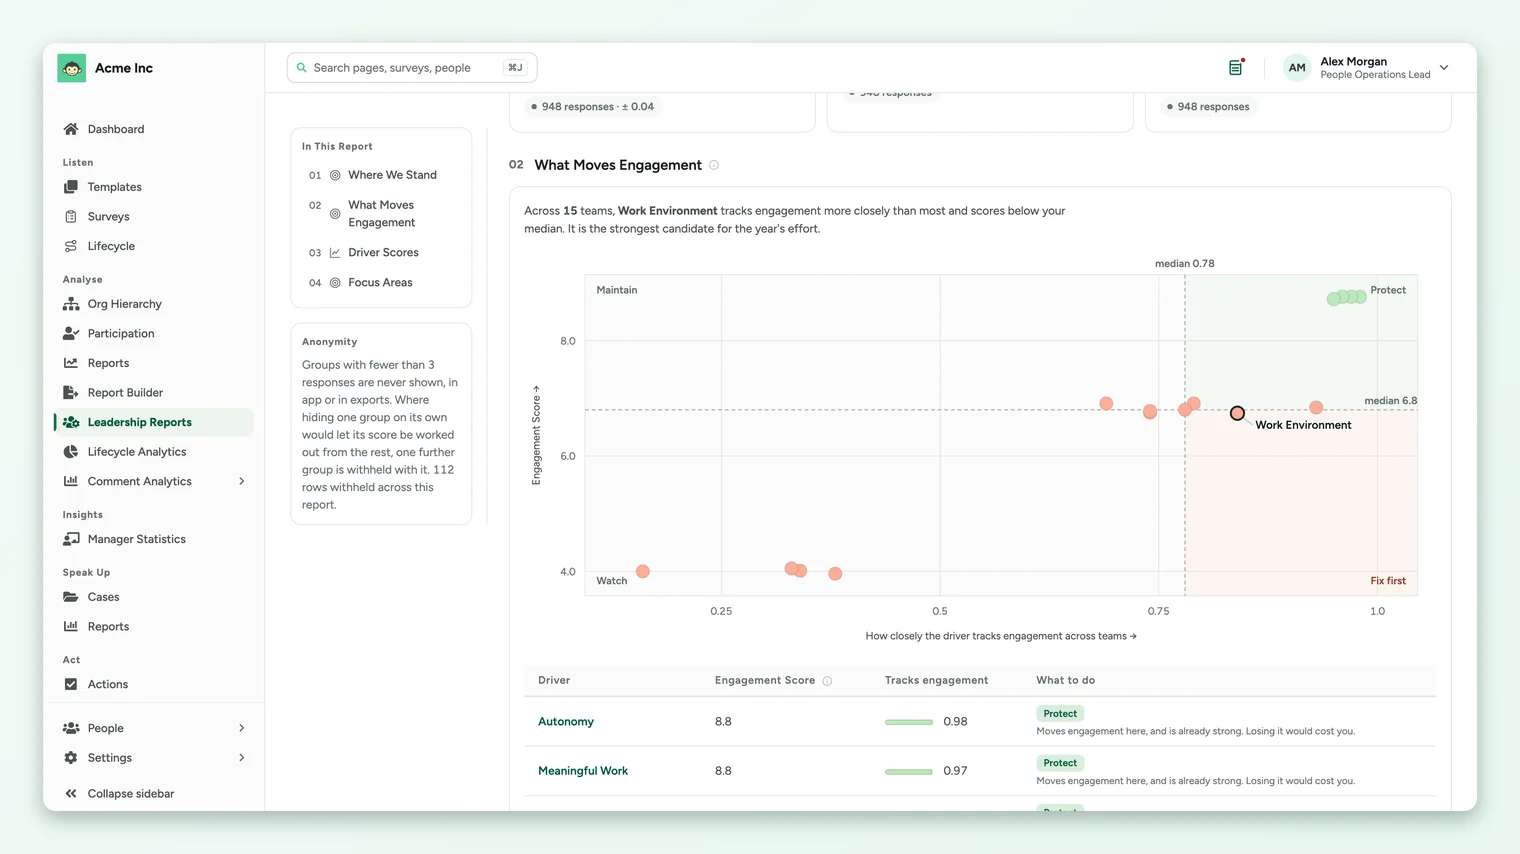
A driver that moves with engagement is a candidate to act on, not proof that acting on it will move engagement. The block needs at least 8 groups with enough responses; with fewer, it says there are not enough groups to tell.
What Explains Engagement
This block asks whether it matters which group someone is in. For each way of cutting the organisation (manager, team, location and so on) it shows the share of variation in engagement that lies between those groups rather than inside them, with a plain reading: explains a lot of it, explains some of it or barely matters here.
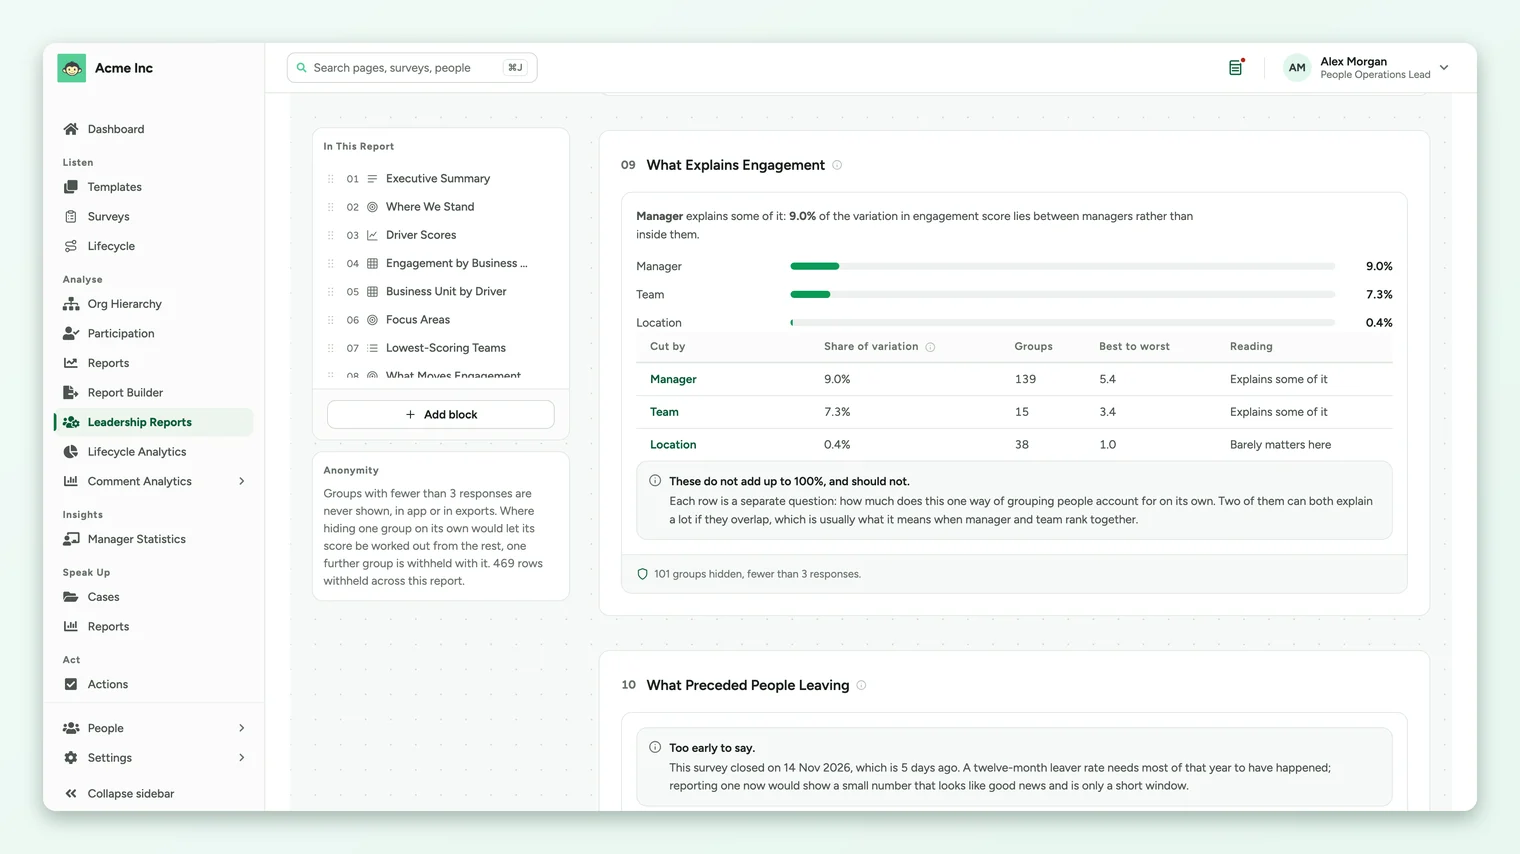
Each row is a separate question: how much this one way of grouping people accounts for on its own. Two can both explain a lot when they overlap, which is usually what it means when manager and team rank together.
What Preceded People Leaving
This block looks back. It takes the groups as they scored when the survey ran, counts who actually left in the twelve months after, and shows which drivers were weakest in the groups that lost the most people. It reads separation dates from your employee records.
- It needs most of that year to have passed. Until then it says Too early to say, because a short window would show a small number that looks like good news.
- It shows counts per group, never the people in them, and leaves out groups too small to report.
- When no driver tracked who left, it says so.
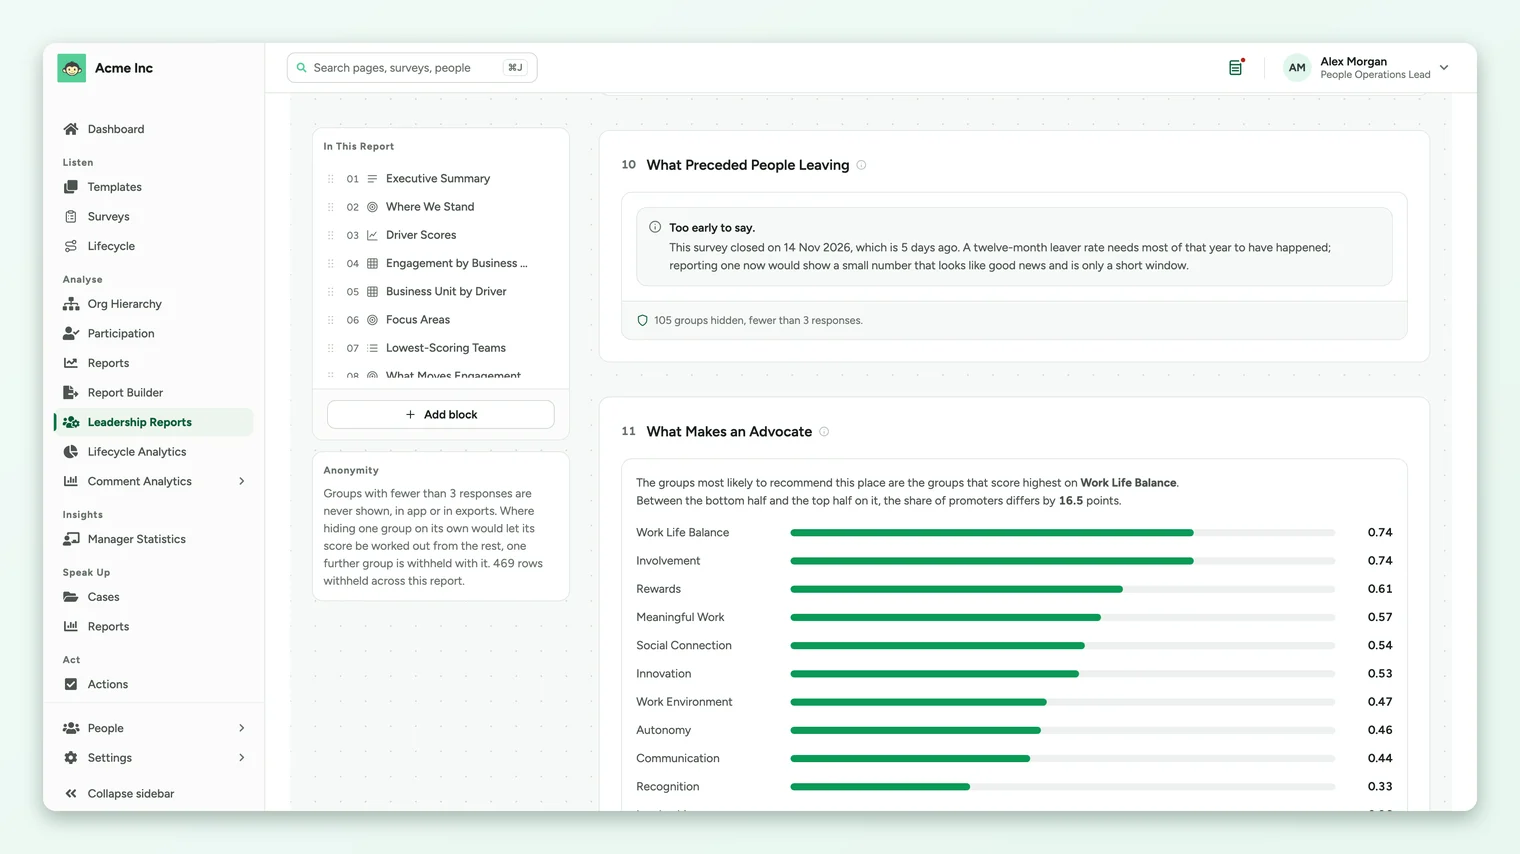
This block reports what happened after a past survey. It does not predict who will leave. For leading indicators on the current survey, use the Retention Risk Signals standard report.
What Makes an Advocate
eNPS tells you how many people would recommend working here. This block shows what separates the groups that would from the groups that would not: it compares each driver's score with the share of promoters across teams, and ranks the drivers by how closely they track it (1.0 would be perfect; 0 not at all).
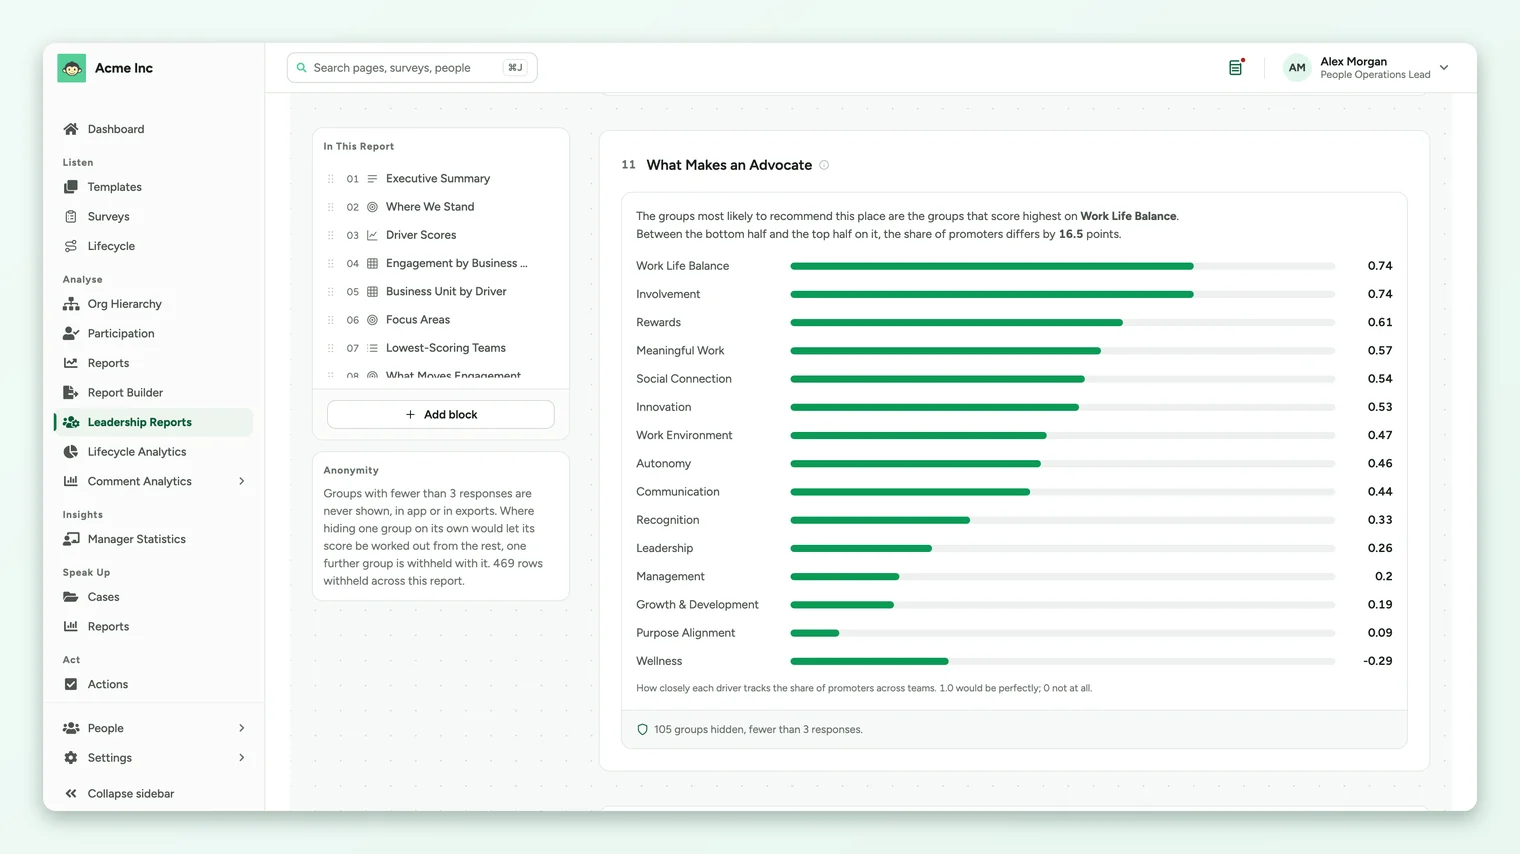
It uses the share of promoters rather than the eNPS score itself, because two very different groups can share one eNPS.
Where Opinion Is Split
An average of 7.0 can be a contented team or two camps. This block ranks groups by how many of their answers sit at the ends of the scale rather than in the middle, and how many sit at the unhappy end, with the spread of answers for each group.
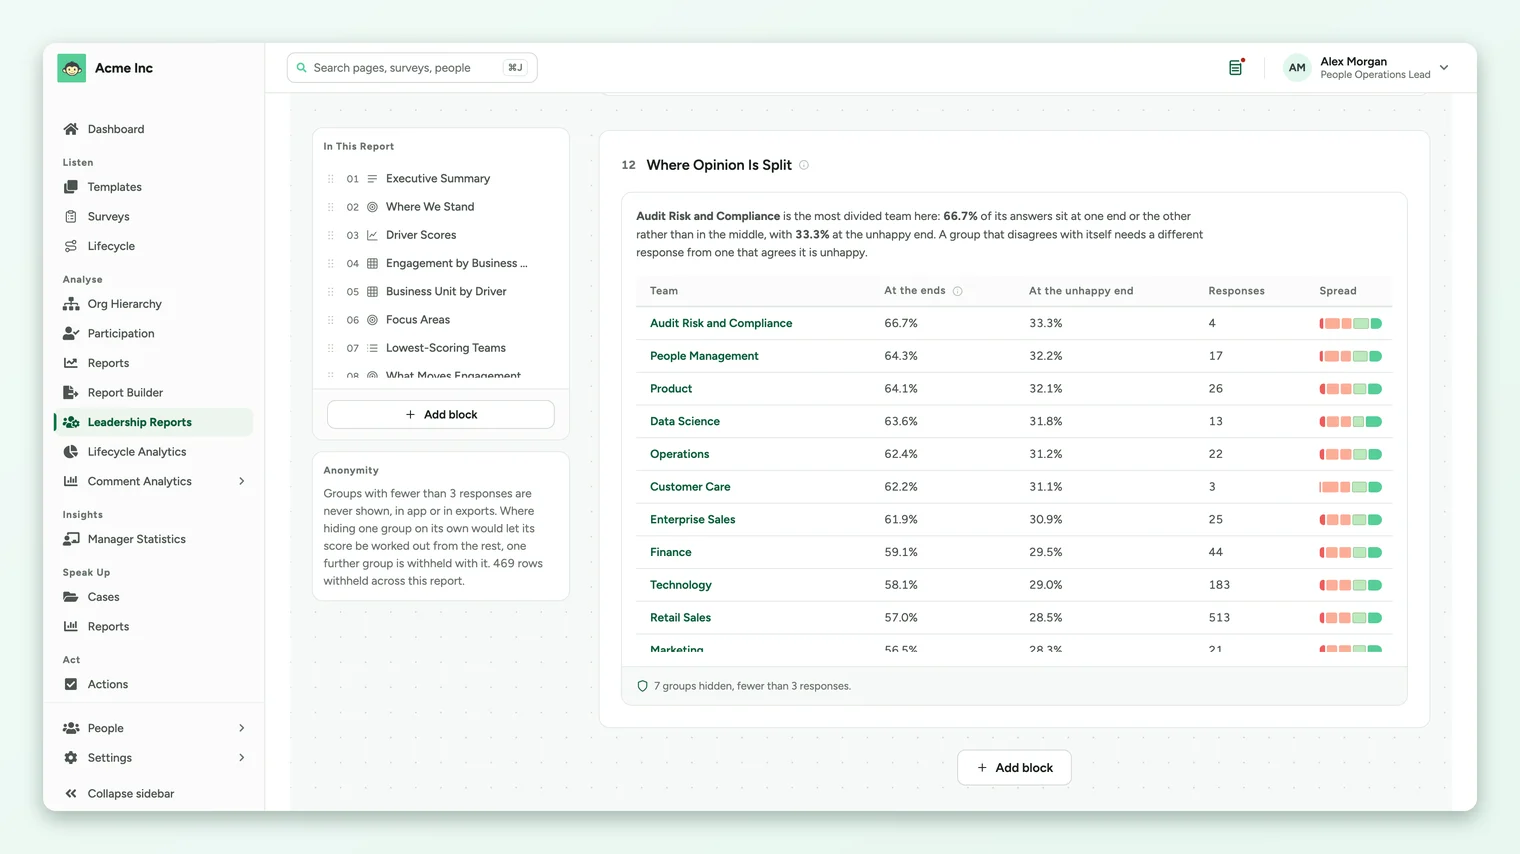
A group that disagrees with itself needs a different response from one that agrees it is unhappy.
Focus Areas
Focus Areas lists the groups below the organisation average and ranks them by impact: how many people improvement would reach, not just the lowest score. The CHRO and HR business partner packs include it.
Frequently asked questions
Can I add these blocks to any report?
Yes. They are in the Analysis group of the block library. See Build a leadership report from blocks.
Why does a block say there are not enough groups?
These blocks compare groups with each other, so they need enough groups with enough responses to say anything reliable. Narrowing filters reduce the number of groups available.
Do anonymity rules apply to the analysis?
Yes. Groups below the threshold are left out of every analysis, and the block notes how many groups it hid.
Where to go next
Your feedback helps us improve the Help Center.