

Understand the org hierarchy chart in CultureMonkey
How CultureMonkey builds your org chart from the manager field, who can open it, how the current and survey hierarchies differ, and how to read manager cards, filters and the Direct and Total scores in each manager's panel.
On this page
- What the org hierarchy is
- Who can open it
- How the chart is built
- Current hierarchy and survey hierarchies
- Find your way around the chart
- Read a manager card
- Filter the chart
- Open a manager's results
- Direct and Total
- How anonymity works in the chart
- Download the employee snapshot
- The classic view
- Frequently asked questions
- Where to go next
The org hierarchy is CultureMonkey's org chart of your company, drawn from who reports to whom. It turns the manager on each employee record into a reporting tree, from your top leaders down to individual contributors. From that tree you can open any manager and read participation, the overall score and driver scores, either for their direct reports or for everyone below them.
Related releases: Survey hierarchies now stay as they were at launch (October 23, 2026); Org Hierarchy now opens on a new org chart (October 6, 2026); Trace a driver score to its questions and see eNPS by manager (August 27, 2026). See every dated change on Product Updates.
This guide covers the org chart that has been the default view since October 6, 2026: who can open it, how the tree is built and kept current, how to move around it, what each card and panel shows, and how anonymity applies. For an overview of the feature, see Org Hierarchy.
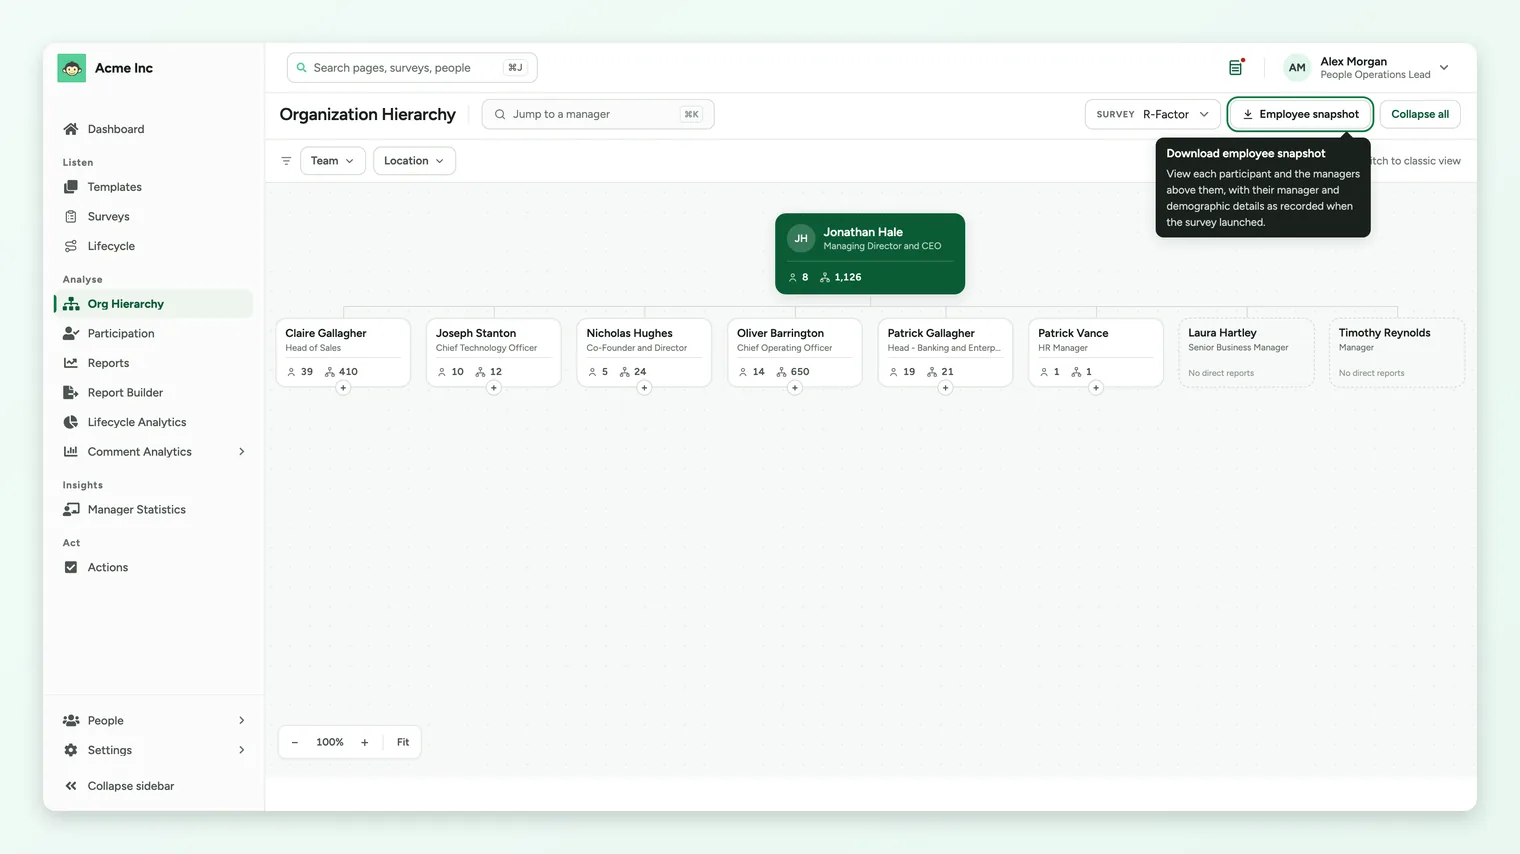
CultureMonkey builds the chart from the manager field on each employee. Cards show headcounts: Direct reports and Total reports (everyone below, at every level). Click a card to see that manager's participation, overall score and driver scores for Direct or Total. Each survey keeps the hierarchy from its launch day, and the current hierarchy rebuilds every night. Scores for groups below your survey's minimum responses stay hidden; names and headcounts always show.
What the org hierarchy is
Teams, locations and business units are flat groupings: an employee belongs to one team or one office. The org hierarchy is different. It is a multi-level tree that follows your reporting lines, so you can ask how everything under a given leader is doing, not only one team.
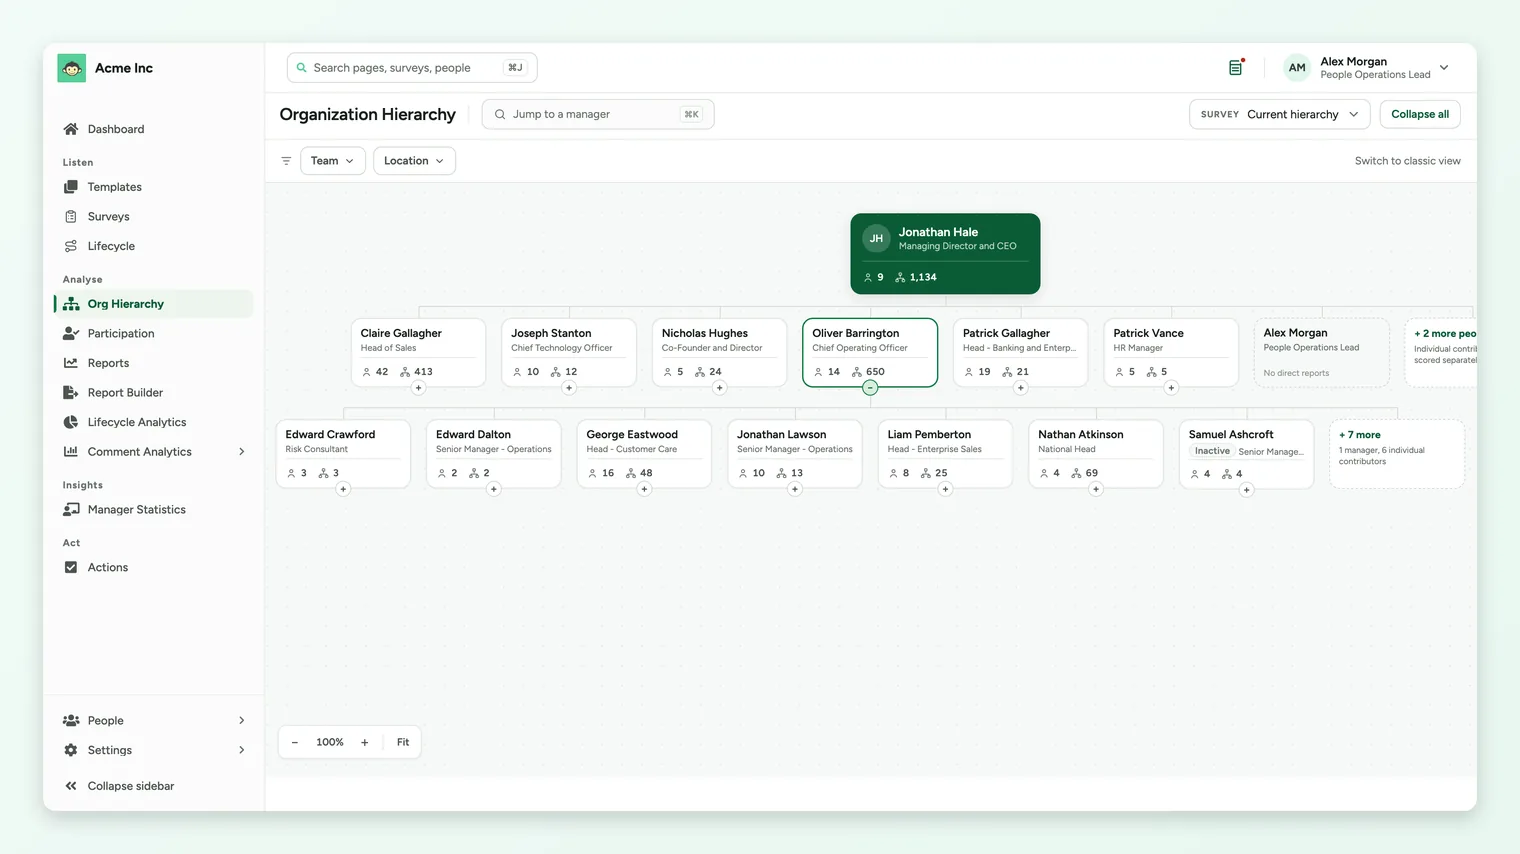
You find it under Org Hierarchy in the Analyse group of the sidebar. The page opens on a full-canvas chart headed Organization Hierarchy. From any manager on the chart you can go on to the Lineage Explorer, which compares the managers who report to that person in one heat grid.
Who can open it
The org chart is for Super Admins. Sub Admins can open it when it is switched on for sub admins on your account, and they see only the surveys and people they can already access. Managers and employees cannot open the org chart or the Lineage Explorer.
- Switching it on. Org Hierarchy, and its sub admin access, are switched on for your account by CultureMonkey. If you don't see Org Hierarchy in your sidebar, contact your Customer Success Manager or CultureMonkey support. When it is switched on, CultureMonkey also builds hierarchies for your past employee surveys in the background.
- Sub admin scope. A sub admin's scope is set by demographics such as team, location, business unit or business group, never by a branch of the hierarchy. The chart and its numbers are limited to that scope. See Restrict a sub-admin's data scope.
- Managers. Managers read their own results on their dashboard, for their direct reports or for everyone below them. See A tour of the manager dashboard.
How the chart is built
There is nothing to draw. The tree comes from one field you already keep: each employee's manager. You set it when you add or import employees, through the API, by SFTP, or through an HRIS integration that carries the manager, such as Keka. See Set up manager-employee relationships and Import managers from a CSV.
- One manager per employee. Each employee has at most one manager. Dotted-line and matrix reporting are not supported.
- People with no manager sit at the top. When several people have no manager, they sit side by side under a single Organization card at the top of the chart.
- Anyone with reports is a manager on the chart. Everyone else is an individual contributor.
- Broken lines don't break the chart. If a reporting line loops back on itself, or points to a manager who isn't in CultureMonkey, the chart still draws and the people affected appear at the top. Correct their manager field to put them in the right place.
- Departed managers stay while needed. An inactive or deleted manager stays in the tree, tagged Inactive, while an active employee still reports to them directly. This keeps the people below them connected.
You cannot edit reporting lines in the chart itself. To move someone, change their manager in your employee data.
A worked example
Suppose your employee data says:
- Dana has no manager
- Sam reports to Dana
- Priya and Lee report to Sam
- Alex reports to Priya
Dana sits at the top. Sam's card shows 2 direct reports (Priya and Lee) and 3 total reports (Priya, Lee and Alex). Priya's card shows 1 direct report and 1 total report. Lee and Alex are individual contributors.
Current hierarchy and survey hierarchies
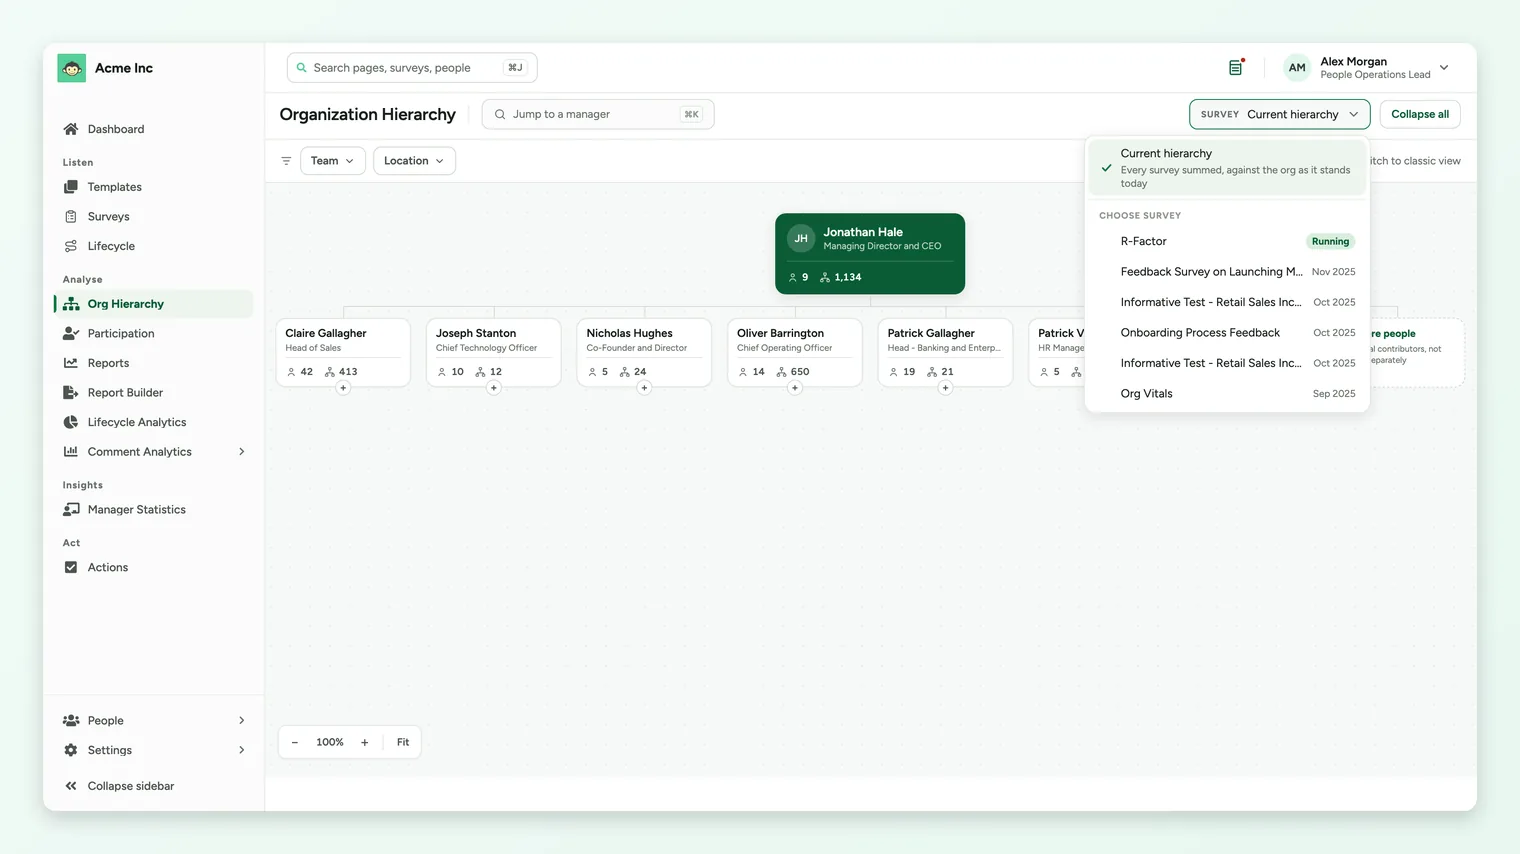
The survey picker at the top right of the chart decides which tree you are reading.
| Option | What it shows | When it changes |
|---|---|---|
| Current hierarchy | Your org as it stands today, with every survey summed against it. | Rebuilt every night at midnight in your account's time zone, after a change to a manager. A change you make today shows tomorrow. |
| Choose survey | One survey's results against the hierarchy it had at launch. Surveys are listed newest first and tagged Running or with the month they closed. | Frozen at launch. Responses update the scores as they arrive, but a later reorg never moves that survey's results. |
- What a survey's tree includes. It is built at launch from the survey's participants plus their full chain of managers. People added to the survey later attach to that frozen tree.
- Which surveys get a tree. Employee surveys only. Lifecycle and candidate surveys have no hierarchy.
- Wrong lines at launch. If reporting lines were wrong when a survey launched, contact your Customer Success Manager. The CultureMonkey team can rebuild that survey's hierarchy from a corrected file.
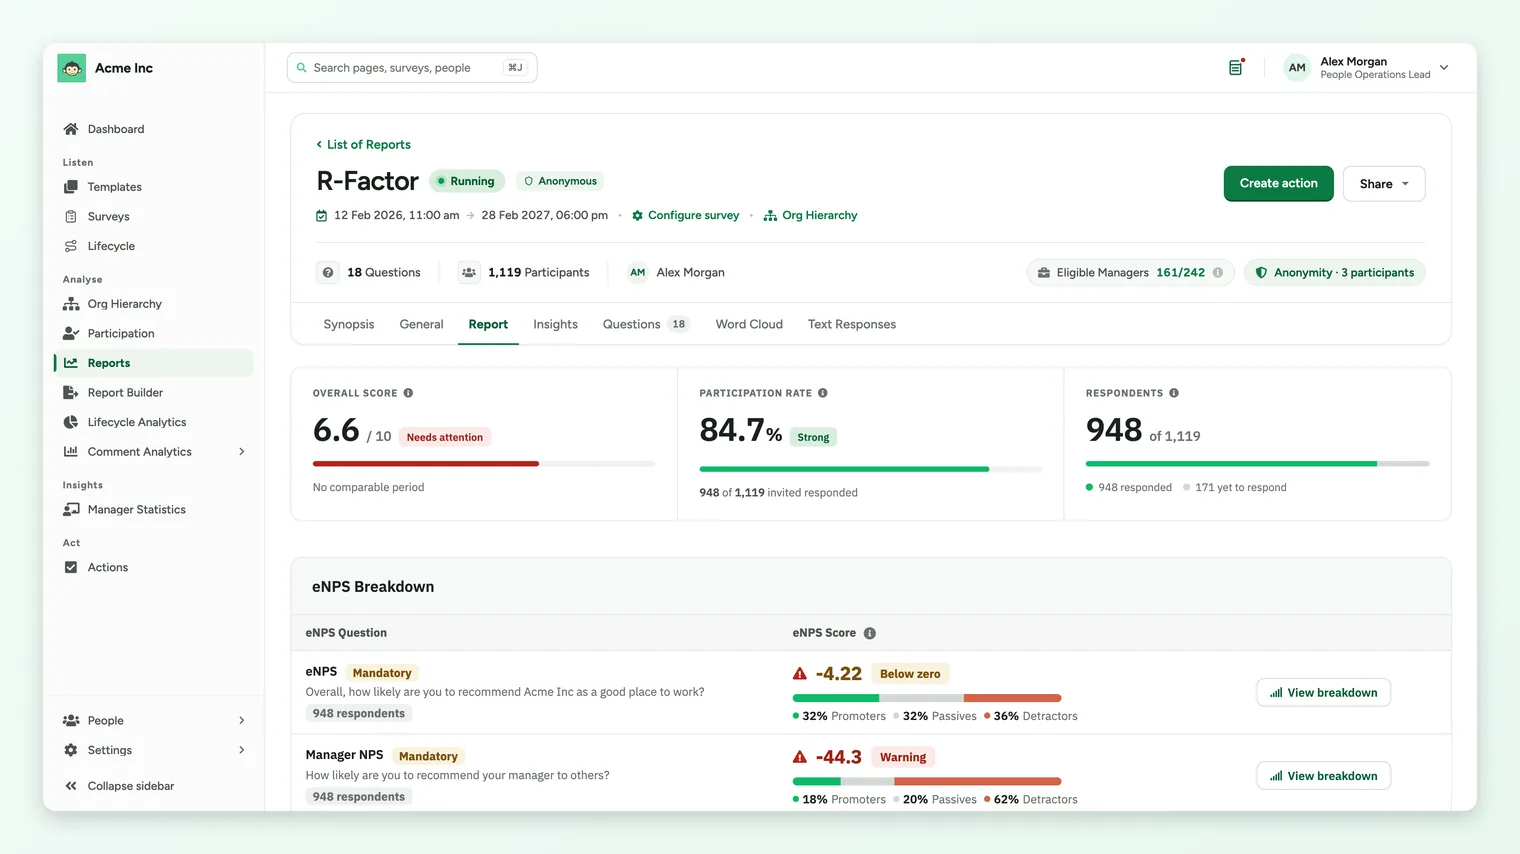
- From a report. A survey report header carries an Open this survey in Org Hierarchy link that opens the chart with that survey already selected.
Find your way around the chart
- 1Open Org Hierarchy from the Analyse group in the sidebar.
- 2Pick a survey in the picker, or leave it on Current hierarchy.
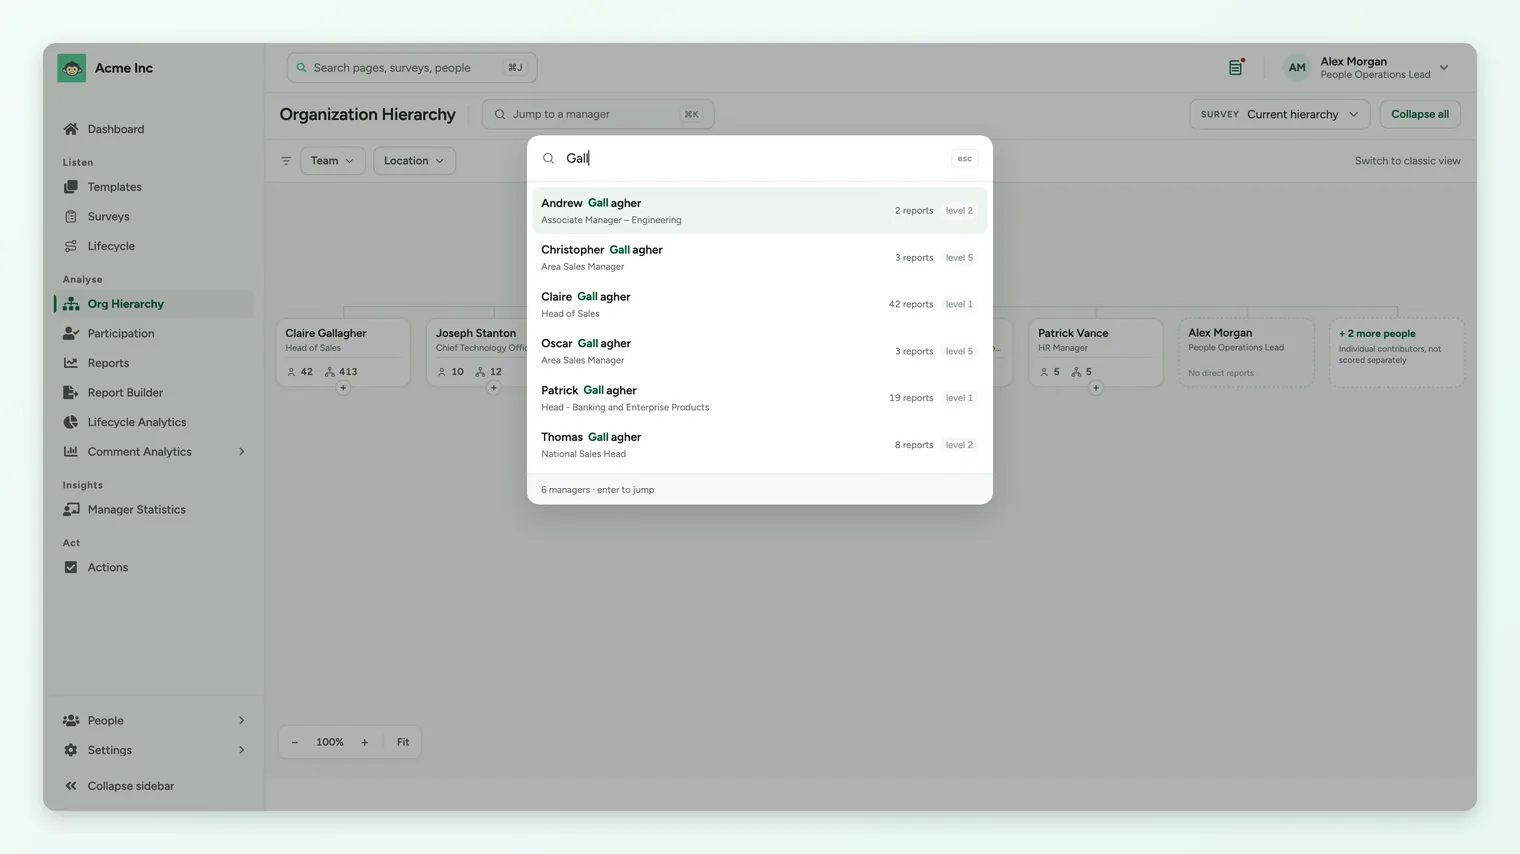
- 3Find a manager. Click Jump to a manager or press Cmd+K. Type at least 2 characters; the search covers managers only and shows the top 10 matches. Pick one and the chart opens on them, loading the levels in between.
- 4Expand and collapse branches with the expand and collapse chip on each card. Collapse all folds the tree back to the top.
- 5Pan and zoom the canvas with Zoom out, Zoom in and Fit in the corner. The current zoom level shows as a percentage.
Read a manager card
Cards show headcounts, not scores. Each card carries two counts, each with an icon; hover over a count to see its label. Scores are in the manager panel and in the Lineage Explorer.
| On the card | What it means |
|---|---|
| Direct reports | People whose manager is this person. |
| Total reports, all levels below | Everyone below this person, at every level, direct reports included. Shows a dash when no one reports to this person. |
| No direct reports | An individual contributor. |
| Inactive | An inactive or deleted employee kept in the tree to connect the people below. |
Filter the chart
The filter bar sits under the header. By default it offers Team and Location. If you'd rather filter by business unit or business group, ask your Customer Success Manager to change the filters for your account.
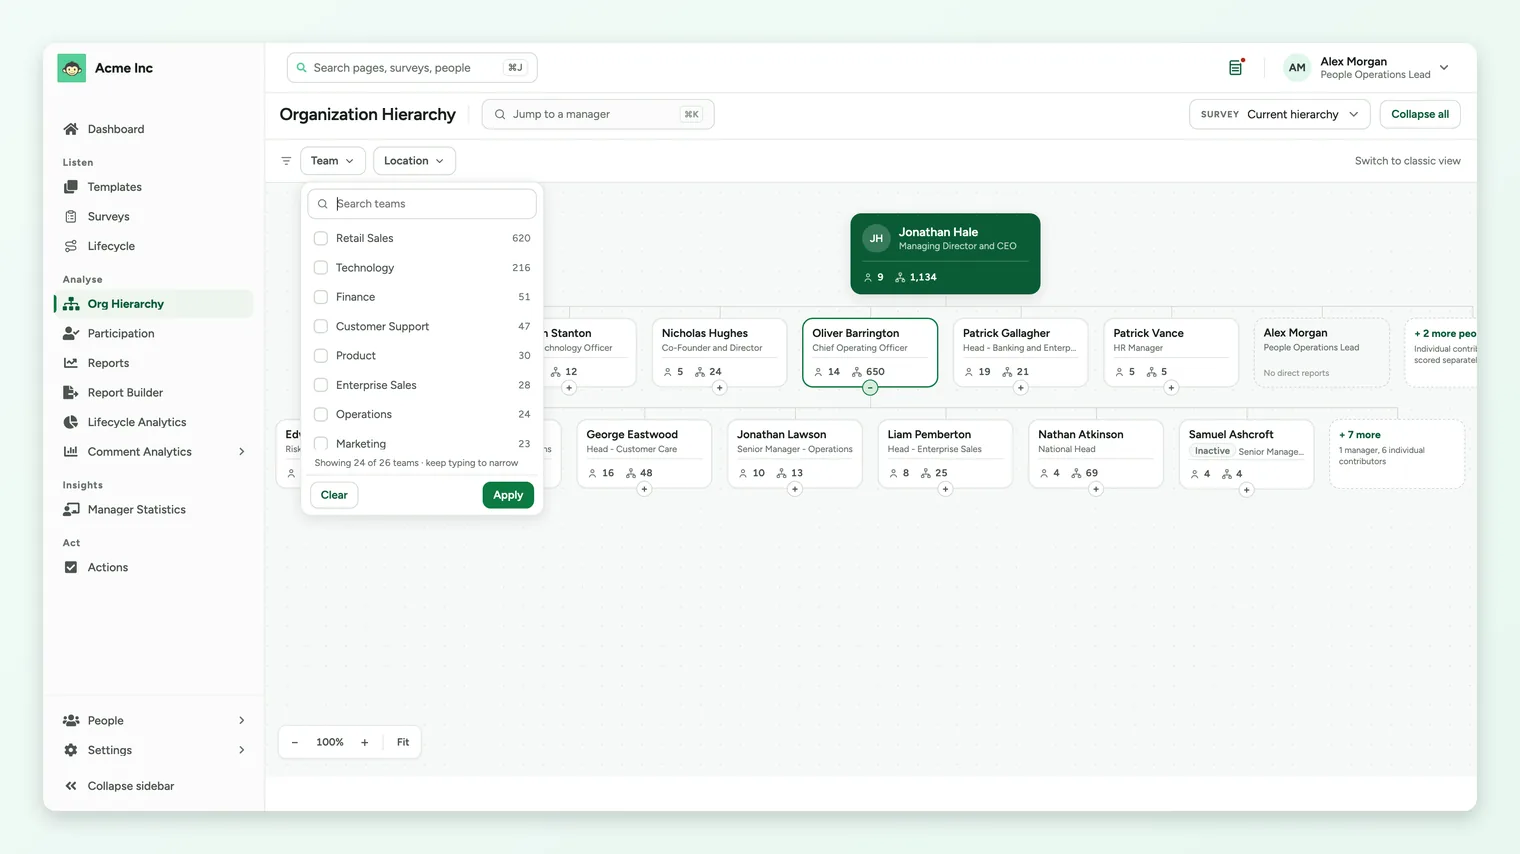
- Each filter has a search box and shows how many people match each value. Pick values, then click Apply. Clear resets one filter and Clear filters resets them all.
- Values within one filter combine with OR. Different filters combine with AND.
- Filters dim the cards that don't match rather than removing them, so the reporting lines stay readable. Matching cards carry a dot.
- The same filters carry into the Lineage Explorer.
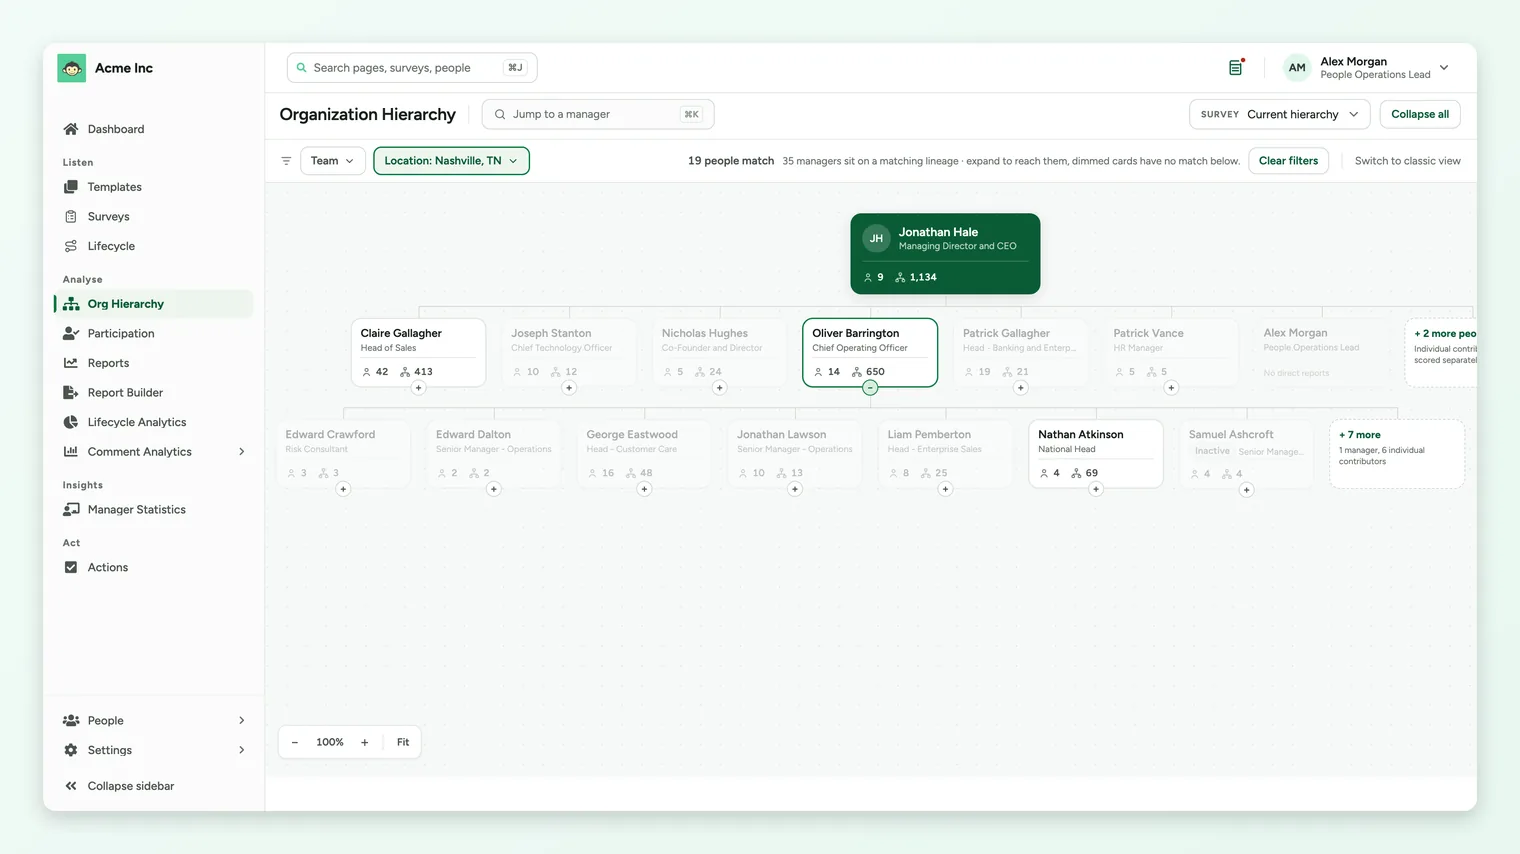
If nothing matches the survey and filters you picked, the chart shows No organization data found. Pick a different survey or clear a filter.
Open a manager's results
Click a manager's card to open their panel. The header shows their direct and total counts, and two tabs switch the panel between Direct and Total. When everyone below the manager is a direct report, the panel notes Total is the same as Direct.
- OVERALL: the overall score for the scope you picked.
- PARTICIPATION: the participation rate, with respondents out of participants.
- DRIVER SCORES: a score for each driver. A driver held back for anonymity shows a dash, labelled hidden for anonymity.
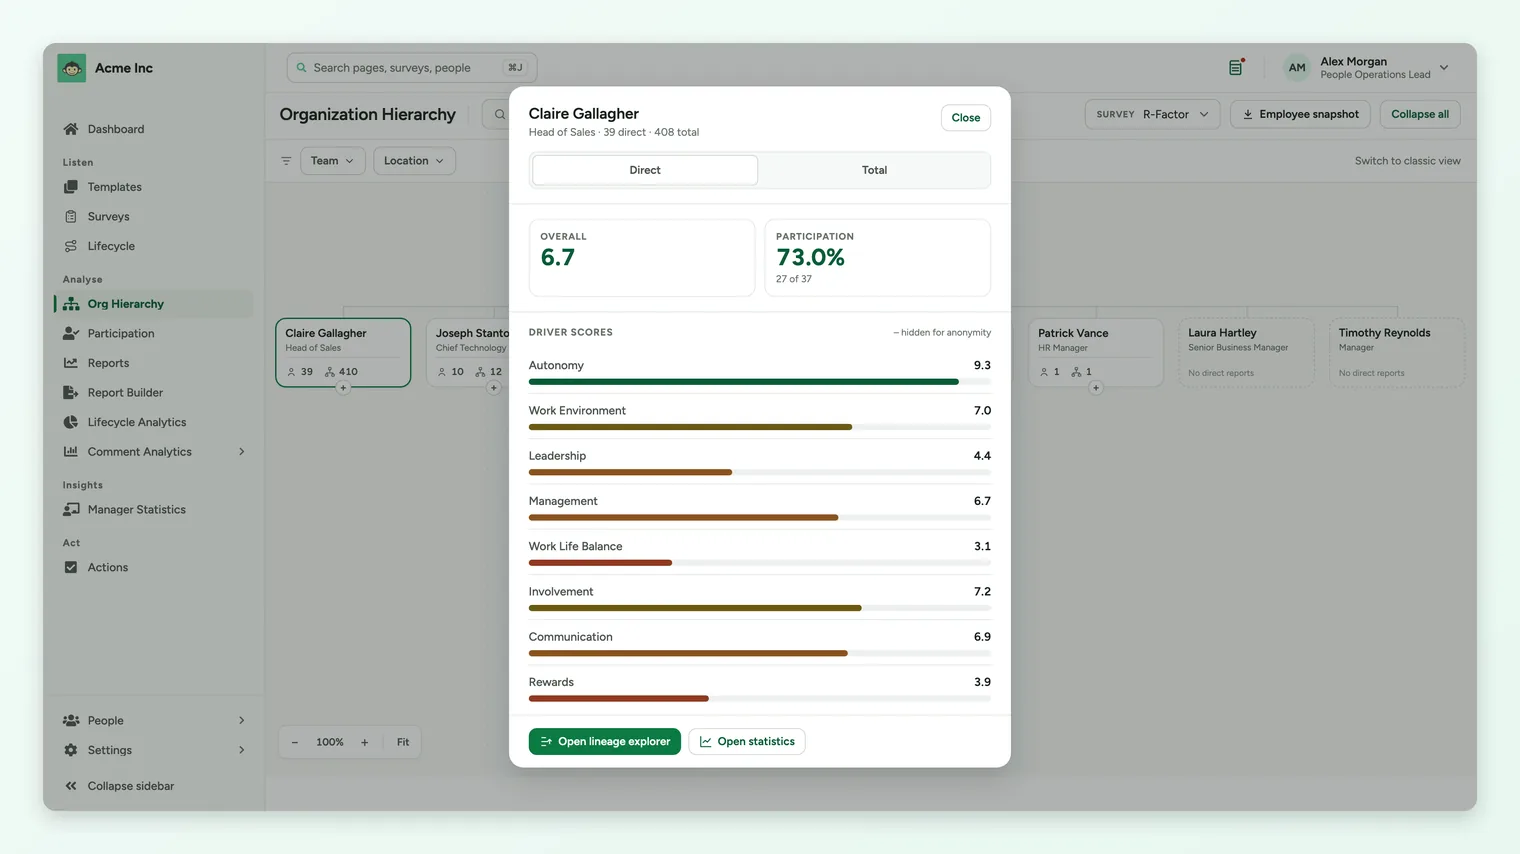
Scores show in your account's scale (out of 5, out of 10 or a percentage) and are coloured in five bands. eNPS does not appear in the panel; you'll find it in the Lineage Explorer once a survey is selected.
The buttons at the bottom of the panel take you further:
- Open lineage explorer opens the Lineage Explorer on this manager, comparing the managers who report to them. It shows when the manager's scores can be displayed.
- Show reports in chart expands the manager's reports on the canvas. It shows when the manager's scores are hidden for anonymity.
- Open statistics opens the manager's page in Manager Statistics, when Manager Statistics is on for your account. See Manager Statistics.
Direct and Total
Every manager can be read two ways. Using Sam from the worked example above:
| Scope | Who it covers | Sam's example |
|---|---|---|
| Direct | The people who report to the manager. Use it to see how the manager's own team is doing. | Priya and Lee |
| Total | Everyone below the manager at every level, direct reports included. Use it to see the whole part of the org they lead. | Priya, Lee and Alex |
Total always includes Direct. There is no indirect-only view. For more on reading results by manager across the product, see See engagement, eNPS and participation by manager.
How anonymity works in the chart
- The threshold. For a survey, scores need the survey's minimum number of responses. The current hierarchy uses your dashboard threshold. See The response threshold and Anonymity thresholds explained.
- Direct and Total are checked separately, driver by driver, against the people able to answer that driver. A manager's Total can show while their small direct team stays hidden.
- The other scope is offered. When one scope is too small, the panel says its scores are hidden for this manager and, if the other scope is large enough, offers View Total scores instead or View Direct scores instead. A hidden panel lists the manager's direct reports, each tagged Individual contributor, N reports or Inactive.
- Structure is never hidden. Names and headcounts always show. A hidden scope shows the headcount from the tree, never the number of people who responded.
- Exports follow the screen. The Lineage Explorer export uses the same rules, so it never shows more than you see.
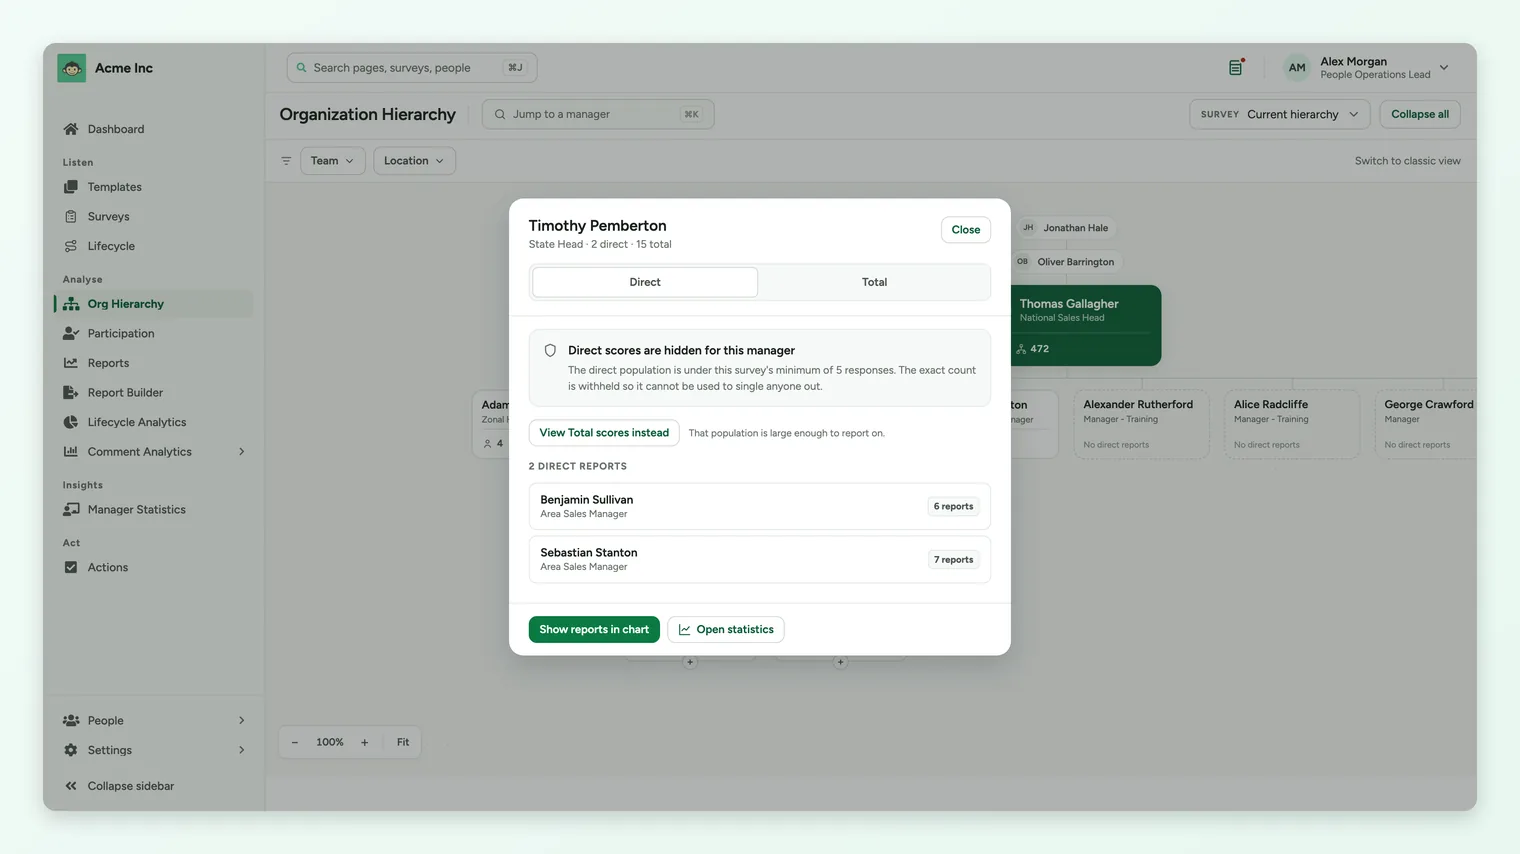
A small direct team with a dash in place of scores is anonymity working as designed. See Why can't I see results yet?
Download the employee snapshot
Super Admins can download an Employee snapshot once a survey is selected. It is a CSV of each participant and the managers above them, with their manager and demographic details as recorded when the survey launched.
- A Survey Participant column marks each row Yes or No, so you can tell participants from the managers added to connect them.
- Files over 5,000 rows are emailed to you instead of downloading.
- Email addresses and group names show their current values, not the values at launch.
The classic view
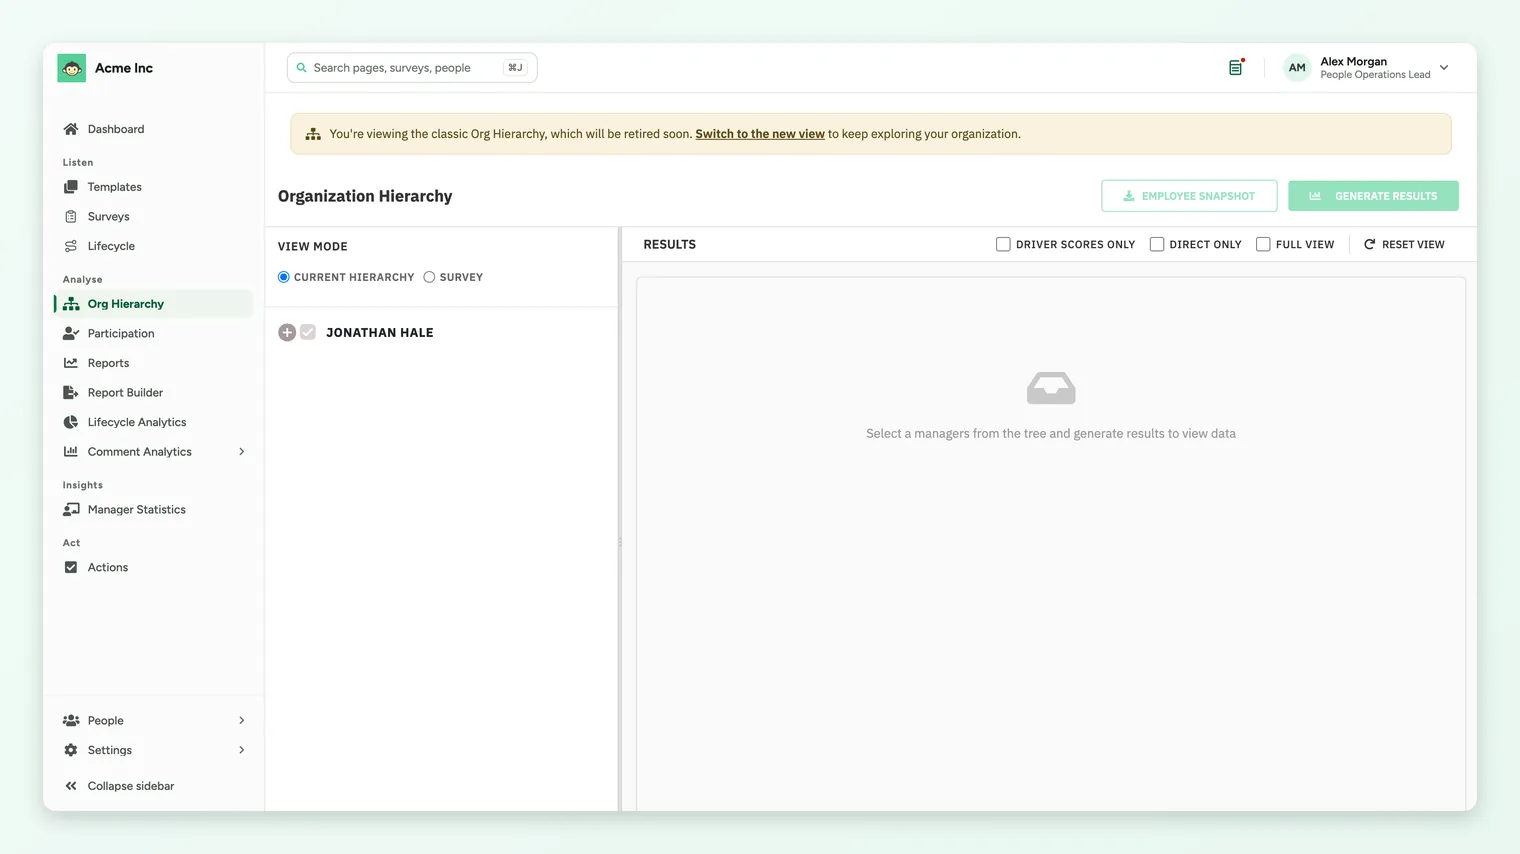
The earlier org chart is still reachable from Switch to classic view, and CultureMonkey remembers your choice. The classic view will be retired soon, so we recommend working in the default chart and the Lineage Explorer.
Frequently asked questions
Can managers see the org chart?
No. The org chart and the Lineage Explorer are admin tools. Managers see their own team's results on their dashboard, for their direct reports or for everyone below them. See Switching views.
Can I move people in the chart?
No. The chart reads reporting lines from each employee's manager field. Change the manager in your employee data, by import, API, SFTP or your HRIS, and the current hierarchy picks it up overnight.
I changed someone's manager. Why hasn't the chart updated?
The current hierarchy rebuilds at midnight in your account's time zone, so the change shows the next day. Survey hierarchies don't change at all: each survey keeps the hierarchy from its launch day, so past results stay with the team people were in when they answered.
Why are there no scores on the cards?
Cards show headcounts only. Click a card to see that manager's scores, or open the Lineage Explorer to compare several managers side by side.
Can someone have two managers?
No. Each employee has one manager in the hierarchy. Dotted-line and matrix reporting are not supported.
Why is someone showing at the top of the chart?
Their manager field is empty, points to someone who isn't in CultureMonkey, or forms a loop. Correct their manager in your employee data.
Why don't I see Org Hierarchy in my sidebar?
It is switched on per account, and separately for sub admins. Contact your Customer Success Manager or CultureMonkey support.
Where to go next
- Compare the managers under a leader: Use the Lineage Explorer
- Get the manager field right: Set up manager-employee relationships
- Scope a sub admin: Restrict a sub-admin's data scope
- A hidden manager? Why can't I see results yet?
Your feedback helps us improve the Help Center.