

Understand Manager Statistics in CultureMonkey
A complete guide to Manager Statistics: the ranked list of your managers for each survey, the filters and charts on it, each manager's scorecard, the exports, who can see it, and how to act on what it shows.
On this page
Manager Statistics ranks your managers by their team's results for a survey, and opens a Manager Scorecard for each one. Instead of reading your organization as one big number, you see which managers' teams are doing well, which need support, who improved since the last survey, and what sits behind each result.
This guide covers where to find the page, who can see it, how the ranked overview and its filters work, what a manager's scorecard shows, how anonymity decides who gets ranked, and how to turn the view into action. It's written for admins, since admins are the only people who can open it.
Pick a survey and a scope (Direct or Total), and Manager Statistics ranks every manager whose team cleared the survey's anonymity minimum by overall score. Filter by team size or movement since the previous survey, read the charts, export the rankings, or open any manager's scorecard to see their trend, drivers, peers and follow-through. CultureMonkey builds it from your survey data, and ranks managers when a survey ends.
What Manager Statistics is for
Most engagement dashboards answer the question "how is the organization doing?" Manager Statistics answers a sharper one: "how is each manager's team doing, compared with other managers and with the last survey?"
That matters because the experience an employee has (whether they feel recognized, supported and heard) is largely shaped by the person they report to. When you can see results manager by manager, you can:
- Recognize your strongest managers with evidence, not gut feel.
- Spot teams that are slipping while there is still time to help.
- Learn what your strongest managers do differently and spread it.
- Focus coaching and support where it will move results most.
Manager Statistics doesn't replace your survey reports or the overall engagement score. It sits alongside them as a manager-focused view built from the same underlying data.
The point of ranking managers is to help them grow, not to name and shame. The strongest results come when a low score starts a supportive conversation ("what's making this hard?"), not a disciplinary one.
Where to find it
Manager Statistics lives in the left sidebar under the Insights section, labeled Manager Statistics. It opens on the ranked overview for your newest survey that has managers to rank.
You can also reach a single manager's scorecard from other places: the Open statistics link on each row of the ranked overview, and the Statistics column on the Managers list.
If you don't see Manager Statistics in your sidebar, the page isn't switched on for your account yet, or your role doesn't include it. Ask your Customer Success Manager to switch it on.
Who can see it
| Role | What they see |
|---|---|
| Super Admin | Every manager in the account |
| Sub Admin | The managers inside their own data scope |
| Manager | No access to the page, including their own scorecard |
A Sub Admin who switches into their manager view does not see Manager Statistics while in that view. Switching back to the Sub Admin view brings it back.
An individual manager sees their own team's results on their own dashboard, never the ranked list, their rank, or a scorecard. If you want to understand what a single manager sees for their own team, use View results as a manager, which lets an admin preview the manager experience.
The ranked overview
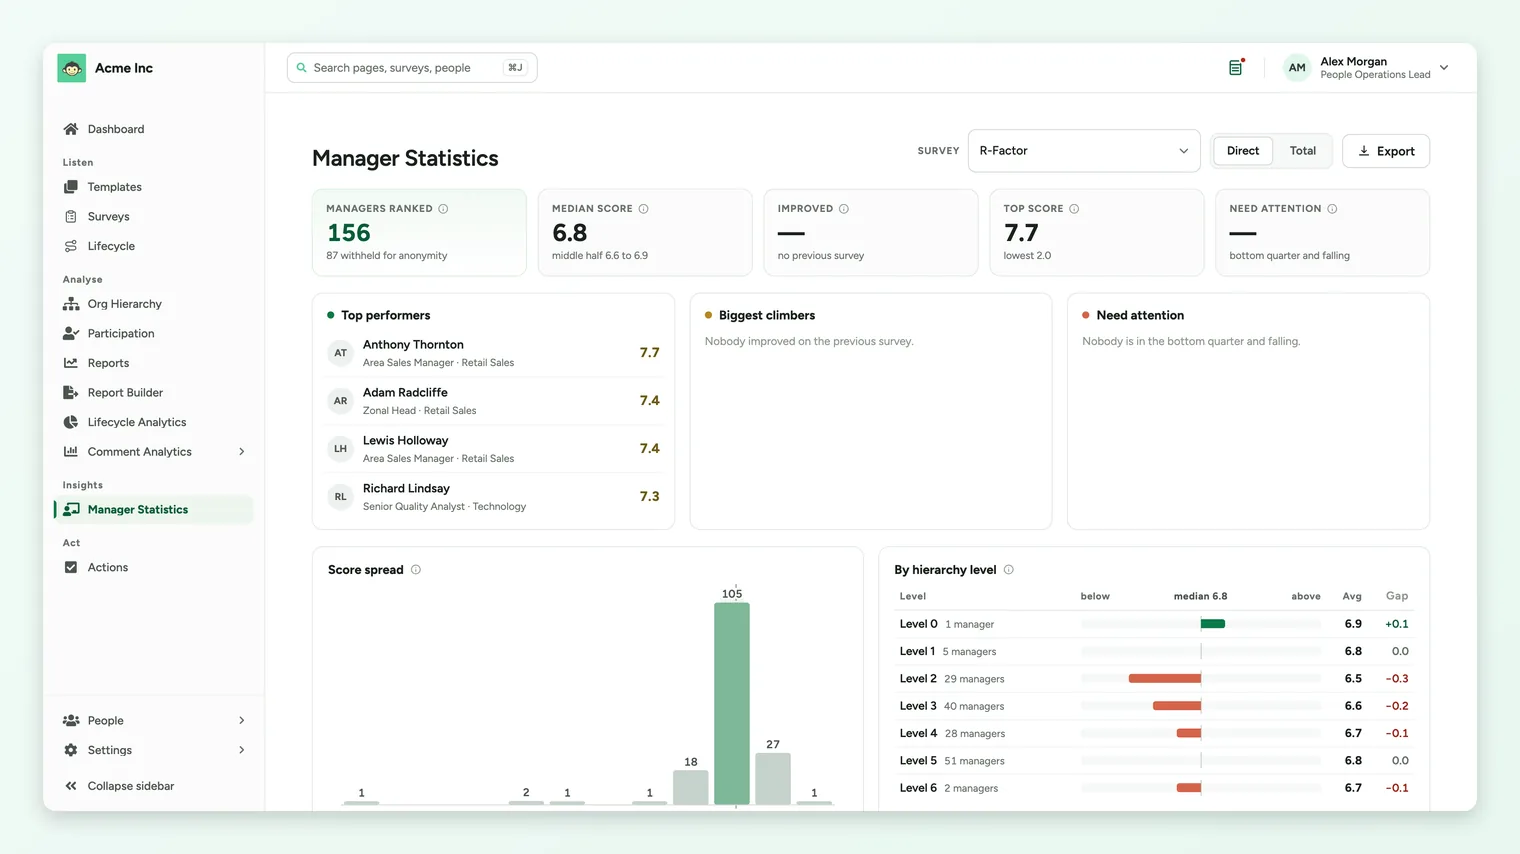
The overview ranks every eligible manager for one survey. Two controls at the top decide what you're looking at:
- Survey. Pick the survey to rank on. Surveys are listed newest first.
- Direct / Total. Direct ranks each manager on the people who report to them directly. Total ranks them on their whole reporting line: direct reports plus everyone below them.
Summary figures and charts
Above the table, summary cards give the headline picture for the survey: managers ranked, the median score, how many improved, the top score, and how many need attention. Below them, a set of insight charts help you read the whole field at once:
| Chart | What it shows |
|---|---|
| Top performers | The managers with the highest overall scores |
| Biggest climbers | The managers whose score rose most since the previous survey |
| Need attention | Managers in the bottom quarter whose score is falling |
| Score spread | How overall scores are distributed across all ranked managers, with the median marked |
| By hierarchy level | Scores grouped by each manager's level in your org tree, so you can compare senior leaders with first-line managers |
The ranking table
The All managers table lists every ranked manager, ordered by overall score. Its columns are:
| Column | What it means |
|---|---|
| Manager | The manager's name and their rank. Managers with the same score share a rank. |
| Team | How many people the manager's score covers, for the scope you picked |
| Score | The team's overall score for the survey |
| vs median | The score minus the median across all ranked managers |
| vs prev | The change since the previous survey |
| Participation | How much of the team took part |
| Trend | A small line of the manager's score over recent surveys |
| Open statistics | Opens that manager's scorecard |
Three tools narrow the list without changing anyone's rank:
- Team size. Show only managers whose team falls in one size tier: 1 to 5, 6 to 10, 11 to 20, 21 to 50, or 51 or more reportees.
- Movement. Choose Any movement, Improved or Declined to see who moved since the previous survey.
- Search. Find a manager or team by name.
Use Export at the top of the page to download the rankings as an XLSX file for the survey and scope on screen. The file contains the ranked managers only, so it never shows more than the page does.
A manager's scorecard
Open any manager to see their Manager Scorecard: their results for the survey you picked, how they compare, and how they've moved over time. The scorecard has its own survey picker and Direct / Total switch.
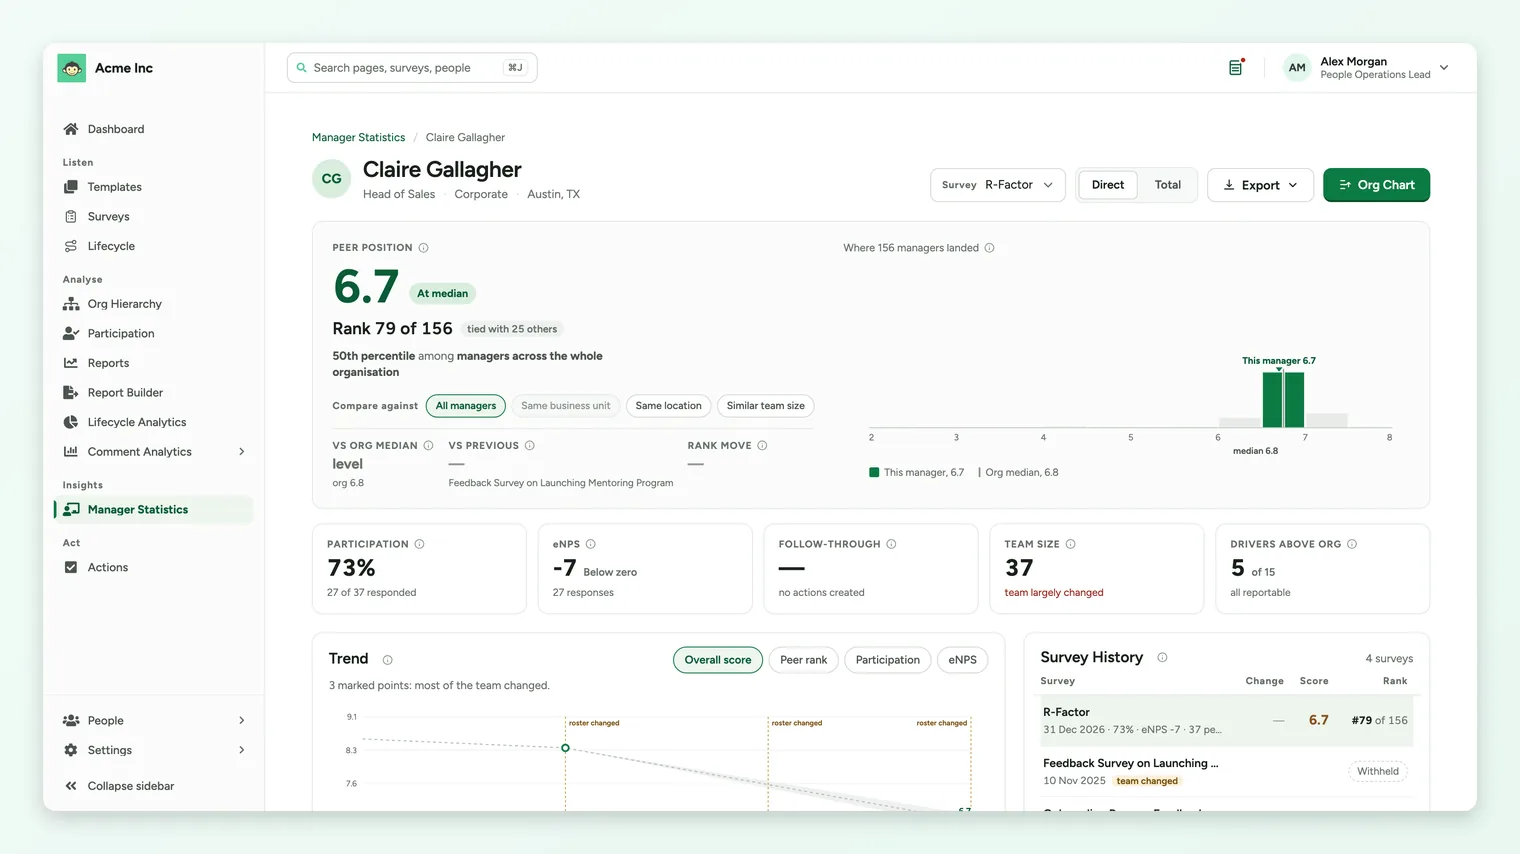
Peer position and the comparison group. The scorecard opens on where the manager places: their overall score, their rank and percentile, the gap to the median, the change since the previous survey, and how many places they moved. Under Compare against, pick who they're ranked with:
- All managers: everyone in the account (or in your scope).
- Same business unit: managers in the same business unit.
- Same location: managers in the same location.
- Similar team size: managers whose team falls in the same size tier (1 to 5, 6 to 10, 11 to 20, 21 to 50, or 51 or more reportees).
The page always names the group it used, so a rank is never shown without saying who it's against. Comparing like with like is fairer: a director of a large department and a lead of four people face different challenges.
The rest of the scorecard is made up of these panels:
| Panel | What it shows |
|---|---|
| Summary cards | Participation, eNPS, follow-through, team size, drivers above the org median and comments |
| Trend | The manager's overall score for each survey, against the peer median and the middle half of managers |
| Survey History | Every survey the manager appears in, newest first. Blank figures were withheld because too few people responded. |
| Drivers | Each engagement driver for the team, weakest first, with the median and middle half of managers, Score, vs Org, vs Prev and Rank |
| Peers | The managers ranked just above and below this one in the chosen comparison. See all managers returns to the overview. |
| Where They Stand | The team's top 3 strengths and top 3 focus areas: the drivers furthest above and below the org median, and the ones that moved most |
| Comment Themes | Topics raised in the team's comments, grouped by keyword. A topic only appears once enough different people raise it. |
| Follow-Through | The action plans the manager committed to after the survey, and how many they've closed |
In the Drivers panel, use View questions on a driver to drill down to the score for each question behind it. That's often where a coaching conversation starts: not "Recognition is low" but "this one question about recognition is low".
The scorecard's Export menu offers two XLSX files: This scorecard (three sheets: Summary, Drivers and Survey history) and All manager rankings (everyone in the comparison you picked). Both match the survey, scope and comparison group on screen.
Anonymity and who gets ranked
Like everything in CultureMonkey, Manager Statistics respects your survey's anonymity minimum. Only managers whose team is above the anonymity threshold are ranked. A manager with a small team, or too few responses, doesn't appear in the ranking for that survey, because showing their score could expose an individual's answers. Exports follow the same rule.
Direct and Total are checked separately. A manager with only a few direct reports may not be ranked on Direct but can still be ranked on Total, where the population is larger.
Managers are ranked when a survey ends. If the page shows No manager scores yet, no survey has closed since Manager Statistics was switched on. The page fills in after the next one closes. See Why can't I see results yet? for more on how thresholds hold results back.
Reading the results well
A ranking is only as good as the judgment you bring to it. A few principles keep it fair and useful.
Pick a fair comparison. "All managers" ranks every manager against everyone else, whatever the size of their team. Before acting on a rank, check it against Similar team size or the manager's own business unit or location.
A score is a starting point, not a verdict. A team of five that lost two members last month will look different from a stable team of twenty. Read the drivers, the question drill-down and the comment themes before drawing conclusions about a manager.
Movement matters as much as position. A manager who inherited a struggling team and lifted its score is arguably doing better than one sitting on a comfortable high. Use vs prev, the Trend panel and the Improved filter to see the journey, not just the snapshot.
Pair it with a conversation. The most valuable thing a low score can produce is a good one-on-one. The data tells you where to look; the manager tells you why.
How to act on it
Manager Statistics earns its keep when it changes what you do next.
- 1Celebrate your top performers and climbers. Use the Top performers and Biggest climbers charts to send specific, personal recognition. Being concrete ("your team's Recognition score rose the most this cycle") makes it land.
- 2Learn what works and spread it. Open the scorecards of your strongest managers, look at the drivers in their Where They Stand panel, and turn those into shareable practices: a short peer session or a written playbook.
- 3Support the managers who need attention. For managers in the Need attention chart, read the weakest drivers, the question drill-down and the comment themes together, then agree on one or two focused changes rather than a long list.
- 4Turn insight into action plans. Create concrete action plans with owners and deadlines for the biggest gaps. The Follow-Through panel then shows whether they get closed.
- 5Re-measure and watch the trend. Run your next survey or pulse and check vs prev and the Trend panel. A rising manager score is strong evidence that coaching is working.
Frequently asked questions
How are managers ranked?
By their team's overall score for the survey you picked, for the scope you picked (Direct or Total). Managers with the same score share a rank. On the overview, vs median compares each score with the median across all ranked managers. On a scorecard, you can choose the comparison group the rank is calculated against.
What's the difference between Direct and Total?
Direct covers the people who report to the manager directly. Total covers their whole reporting line: direct reports plus everyone below them. Total always includes Direct.
Why can't I see Manager Statistics in my sidebar?
Most likely one of two reasons: Manager Statistics isn't switched on for your account, or your role doesn't include it (only Super Admins and Sub Admins can see it, and a Sub Admin loses it while in their manager view). To have it switched on, contact your Customer Success Manager.
Can a manager see their own rank or scorecard?
No. Manager Statistics is an admin view. An individual manager sees only their own team's results on their own dashboard. To preview that experience yourself, use View results as a manager.
Why isn't a manager in the ranking?
Usually because their team is below the anonymity threshold for that survey and scope, or too few people responded. Try the other scope: a manager not ranked on Direct may be ranked on Total. A missing manager protects individual responses; it isn't an error.
Why does the page say "No manager scores yet"?
Managers are ranked when a survey ends. If no survey has closed since Manager Statistics was switched on, there's nothing to rank yet. The page fills in after the next survey closes.
What happened to the manager buckets page?
Manager Statistics used to open on a page of bucket cards, such as Hi-pot Managers and Women in Leadership. It now opens on the ranked overview described here. The older bucket page can still be reached by Super Admins on accounts with Manager Statistics switched on. See Segment managers into performance buckets.
Where to go next
- See what a single manager sees: View results as a manager
- Learn the eNPS split behind the numbers: What is eNPS and how is it calculated?
- Turn findings into follow-through: Create an action
- Read the older bucket view: Segment managers into performance buckets
Your feedback helps us improve the Help Center.